


Project Overview
Key Phrases: Data Wrangling, Preliminary Exploratory Data Analysis (EDA) with Visualizations in Excel, SQL Entity-Relationship Diagram (ERD), Database Management, Interactive and Accessible Visualizations in Tableau, Actionable Insights for Data-Driven Decision Making, Storytelling.
2Market, a multinational supermarket chain operating both online and in-store, sought to enhance sales through a customized marketing strategy. To achieve this, they required insights into customer demographics and advertising data. I utilized data analysis tools such as Excel, SQL, and Tableau to help 2Market make informed decisions for their business.
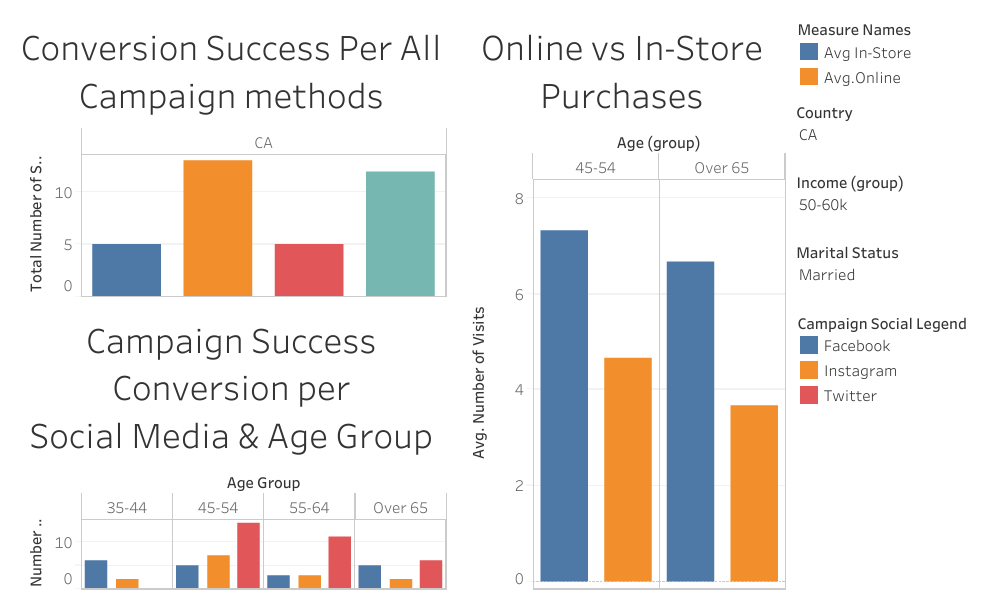
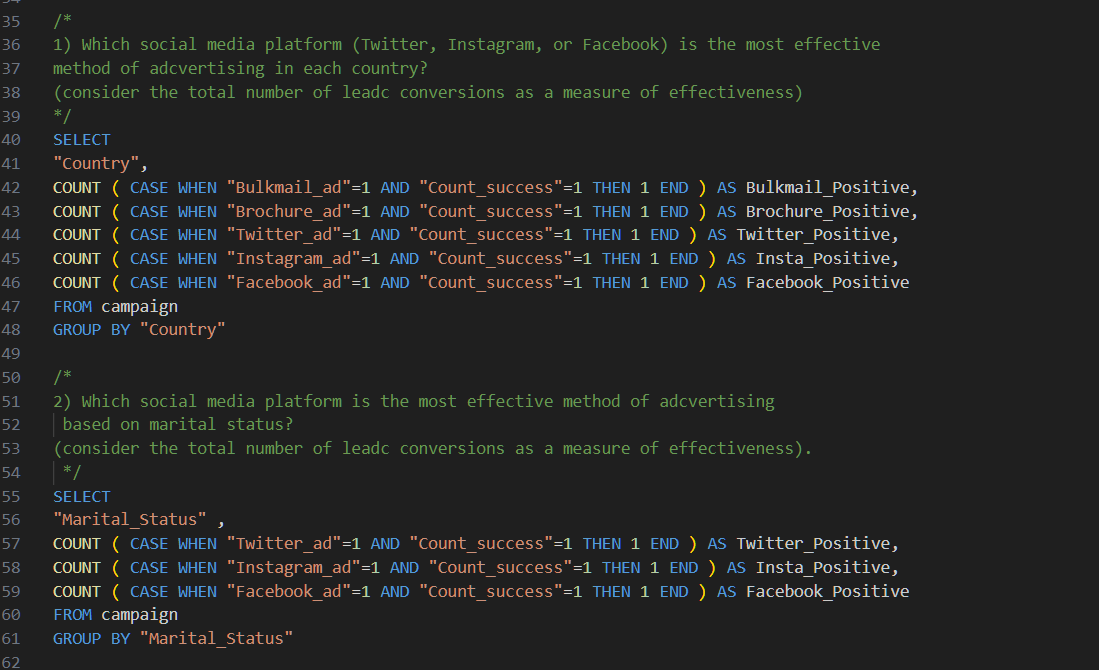
The business case involved addressing specific questions raised by 2Market: Understanding customers' demographics, including age, marital status, and income. Identifying the most effective advertising channels, such as social media platforms, brochures, and bulk mail campaigns. Investigating the relationship between customers' demographics and the best-selling products, aiming to optimize the advertising campaign. Defining the target audience or "Persona" for the upcoming advertising campaign in the next quarter. To tackle this project, I performed data wrangling and conducted initial exploratory data analysis using Excel. Additionally, I created a SQL database with an Entity-Relationship Diagram (ERD) to establish relationships and imported cleaned customer demographic and advertising channel data from CSV files. I then utilized SQL queries to address 2Market's inquiries.
For visualization purposes, I employed Tableau, where I developed four interactive dashboards. To convey a cohesive narrative, I incorporated storytelling techniques and supplemented it with a summary of actionable insights.